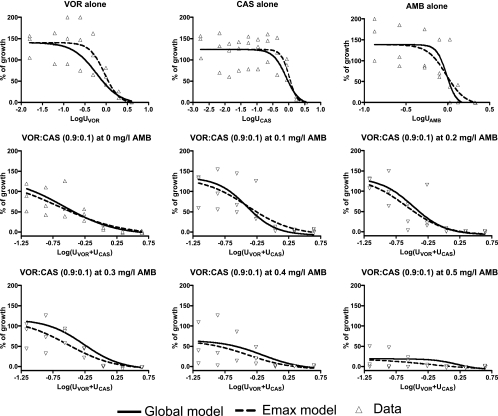
FIG. 2.
Concentration-effect data (triangles) for voriconazole (VOR), caspofungin (CAS), and amphotericin B (AMB) alone and for voriconazole-caspofungin combinations at fixed UVOR/UCAS ratio of 0.9:0.1 in the presence of increasing amphotericin B concentrations for the A. fumigatus 4215 isolate. The regression curves obtained with the global model fitted to all data (solid lines) and with the Emax model fitted to each concentration-effect data individually (dashed lines) are shown.

