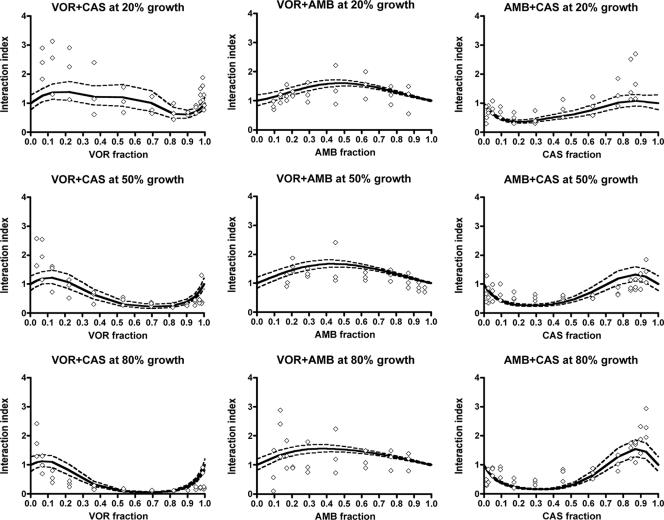
FIG. 3.
Patterns of interaction for the double combinations voriconazole-caspofungin (left graphs), voriconazole-amphotericin B (middle graphs), and amphotericin B-caspofungin (right graphs) for 20% (top graphs), 50% (middle graphs), and 80% (bottom graphs) of growth of the A. fumigatus 4215 isolate. Regression curves (solid lines) and their 95% confidence bands (dashed lines) were derived from the modified global model, where diamonds represent individually determined interaction indices obtained using isobolographic analysis (26). Interaction indices of >1 indicate antagonistic interactions, whereas interaction indices of <1 indicate synergistic interactions. VOR, voriconazole; CAS, caspofungin; AMB, amphotericin B.

