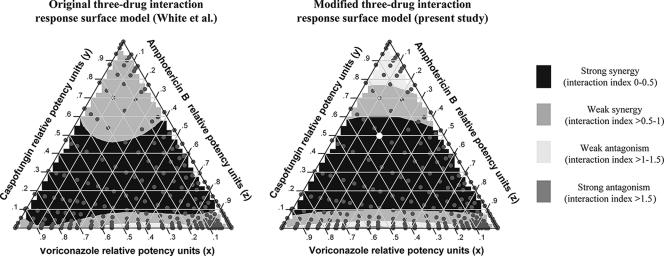
FIG. 4.
Ternary plots of the triple combination of voriconazole, caspofungin, and amphotericin B against the A. fumigatus 4215 isolate for 50% of growth, constructed based on the results of the model of White et al. (40) (left plot) and the modified (right plot) global response surface model used in the present study. The model of White et al. was modified in this study by eliminating the leading factor (1 − x)(1 − y)(1 − z). The ternary display is a triangle with sides scaled from 0 to 1. The labels on each side are the relative potency units of each drug. The color inside the triangles indicates the nature and the magnitude of interaction for mixtures with different relative potency units of the three drugs (gray dots). The relative potency units of each drug at a specific mixture can be found by extending the ticks on each side of the triangles towards the point inside the triangle. For example, the white dot in the right triangle represent the combination of 0.2 potency units of AMB (z), 0.5 potency units of CAS (y), and 0.3 potency units of VOR (x), which is synergistic since the interaction index is <0.5 (black area). The color at the x, y, and z sides of triangles represents interactions of the double combinations amphotericin B-voriconazole, voriconazole-caspofungin, and caspofungin-amphotericin B, respectively.

