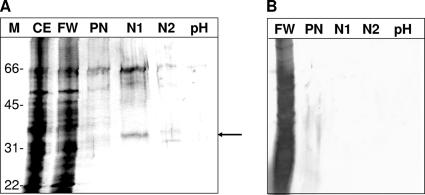
FIG. 1.
Affinity chromatography of cell extract from 3 × 10⁸ G. lamblia trophozoites. Aliquots of fractions were separated by SDS-PAGE. Bands were visualized by silver staining. Lanes: M, sizes of marker proteins (kDa); CE, crude extract; FW, flowthrough plus wash; PN, pre-NTZ (1 mM in PBS); N1, NTZ; N2, NTZ pre-pH shift (pH 2.9); pH, pH shift. The 35-kDa protein is marked with an arrow. (A) TIZ-agarose as matrix; (B) RM4819-agarose as matrix.

