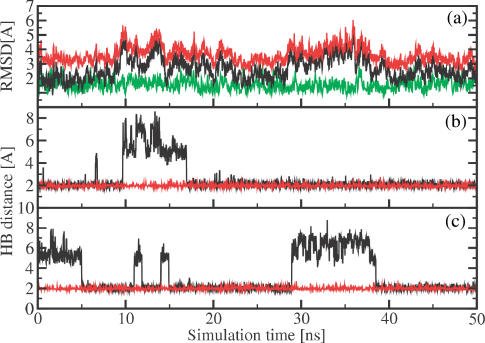
Figure 6.
Molecular dynamics simulation results obtained for RNA 1. (a) Time evolution of the RMSD from the standard A-form (black line) and B-form (red line) for labeled RNA 1. For comparison, the RMSD from the A-form obtained for unlabeled RNA 1 is also shown (green line). (b) and (c): Hydrogen bonding as monitored by (b) the distance between the H3 atom of uracil 6 and the N1 atom of adenine 19 and (c) the distance between the N1 atom of adenine 7 and the H3 atom of uracil 18. While the hydrogen bonds of labeled RNA 1 (black lines) open occasionally, the hydrogen bonds of unlabeled RNA 1 (red lines) remain stable.

