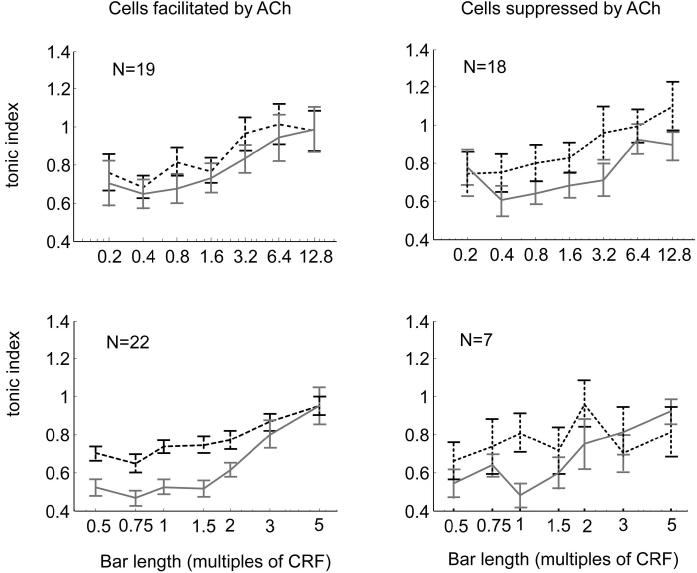
FIG. 5.
Strength of sustained response as a function of ACh. Tonic index for cells measured with bar length ranging from 0.2 to 12.8 times mRF (top) and measured with bar length ranging from 0.5 to 5 times mRF (bottom) for cells facilitated by ACh (left) and cells suppressed by ACh (right). Sustained response was on average increased in the presence of ACh (black dashed curves and error bars) compared with its absence (gray solid curves and error bars). Error bars are SE.

