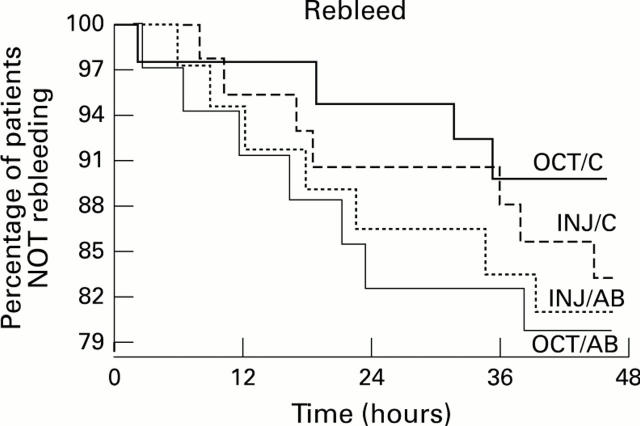
Figure 2 .
: Kaplan-Meier plots for time to rebleeding after sclerotherapy (INJ/AB) or octreotide (OCT/AB) in patients with Child's A or B liver diseases and in patients with Child's C liver function in the sclerotherapy (INJ/C) and octreotide (OCT/C) groups are plotted separately. Time zero indicates commencement of therapy.

