
Figure 1 .
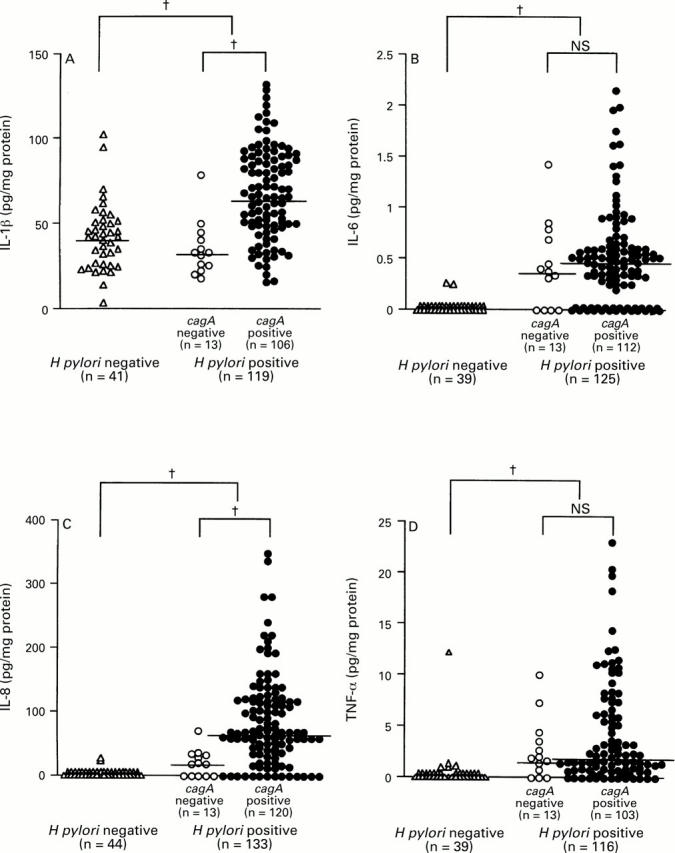
: Production of (A) IL-1β, (B) IL-6, (C) IL-8, and (D) TNF-α and H pylori infection. Large brackets indicate the comparison between H pylori positive and negative specimens and small brackets the comparison between cagA+ and cagA- specimens. Bars indicate median values for each group. †p<0.0001 by Mann-Whitney U test.