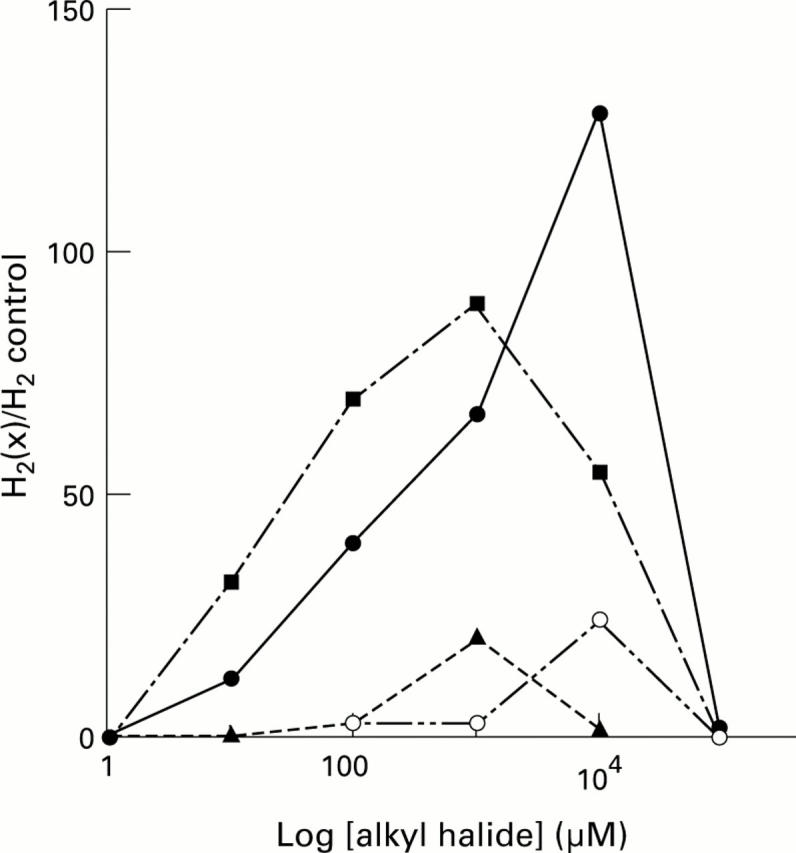
Figure 2 .

: H2 versus alkyl halide (concentration range 1 µM-100 mM). Points are means of normalised measurements at four hours from both methanogenic and non-methanogenic culture experiments (n = 28). Data are expressed as the ratio of H2 (ppm) in alkyl halide-amended cultures to mean H2 (ppm) in unamended control cultures. H2 values were significantly greater than control net H2 for chloral hydrate (closed circles), trichloroethanol (closed squares) ([x]⩾ 10 µM), for trichloroacetic acid (closed triangles) (100 µM ⩽ [x]⩽ 1 mM) and for trichloroethylene (open circles) (100 µM ⩽ [x]⩽ 10 mM).
