
Figure 3 .
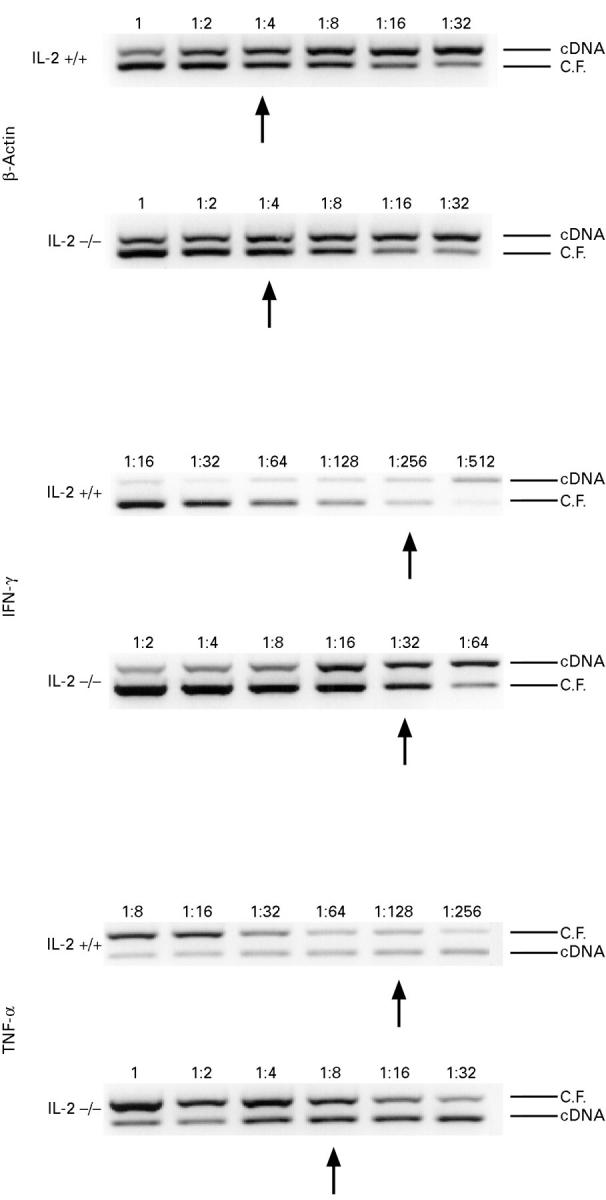
: Semiquantitative competitive PCR assisted amplification of β-actin, IFN-γ and TNF-α mRNA extracted from colonic tissue of IL-2−/− and IL-2+/+ mice at 13 weeks of age. Constant amounts of target cDNA were amplified in the presence of serially diluted competitor control DNA (1, undiluted cDNA: β-actin, pMCQ 3 ng, 28 cycles; TNF-α, pMCQ 3 pg 35 cycles; IFN-γ, pG2PCR106g4 0.125 pg 35 cycles). The dilution at which equally dense bands for control and target DNA were obtained was used for determination of cytokine mRNA expression levels. C.F. = control fragment (competitor control DNA). Arrows indicate the dilution step at which equally dense bands were obtained. The data shown are the results from one knockout and from one wild type mouse and are representative of five mice from each group.