
Figure 4 .
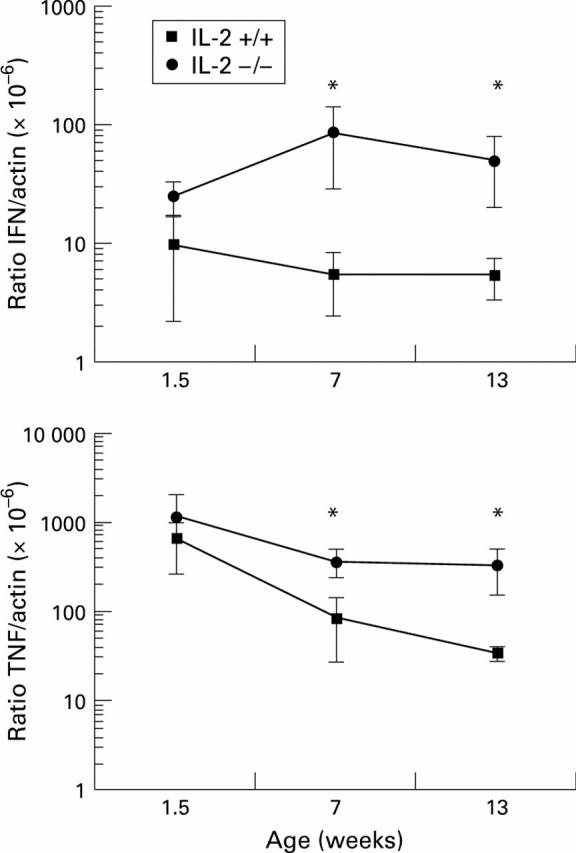
: Semiquantitative determination of IFN-γ and TNF-α mRNA expression in the colon of IL-2−/− and IL-2+/+ mice at 1.5, 7 and 13 weeks of age was performed as described in the legend to fig 3. The values represent the means of five mice per time point for each group. *p<0.05 between IL-2 −/− and IL-2+/+ mice. The ratio of IFN-γ or TNF-α to β-actin was calculated as follows: [concentration of IFN-γ control fragment×dilution factor of target DNA (IFN-γ or TNF-α)]÷[concentration of β-actin control fragment×dilution factor of target DNA β-actin]