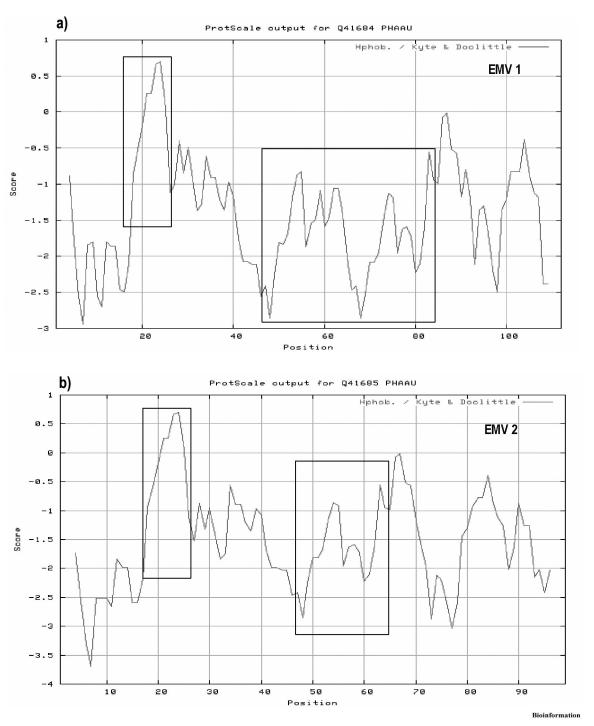
Figure 1.
Hydropathy analysis of predicted proteins EMV1 and EMV2 based on Kyte and Doolittle values, using a seven-residue window. Those values below zero are negative and obviously hydrophilic. Areas corresponding to highly conserved blocks are highlighted in boxes. (a) Hydropathy plot of EMV1 with regions from positions 18 to 26 indicate hydrophilic plant seed protein signature and positions 44 to 83 indicate two 20-mer repeat motifs arranged consecutively. (b) Hydropathy plot of EMV2 with regions from positions 18 to 26 indicate hydrophilic plant seed protein signature and positions 44 to 63 indicate a 20-mer repeat motif.

