Figure 2.
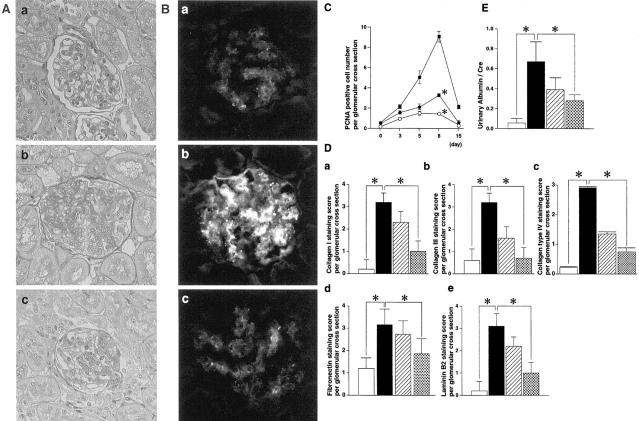
Inhibitory effects of warfarin on Thy1 GN. Effects of warfarin treatment on glomerular cell proliferation (A) and glomerular expression of OX-7 (B). Representative glomeruli of day 0 (a), day 8 of Thy1 GN (b), and day 8 of Thy1 GN with warfarin treatment (0.5 mg/ml) (c) are shown. A: PAS staining. B: Immunofluorescent staining for OX-7. Original magnification, ×200. C: PCNA expression in glomeruli of Thy1 rats. PCNA-positive cell numbers per glomerular cross-section are counted as described in Materials and Methods. Closed squares, nontreated Thy1 rats; closed circles, Thy1 rats treated with 0.25 mg/L of warfarin; open circles, Thy1 rats treated with 0.5 mg/L of warfarin. *, P < 0.001 versus nontreated Thy1 rats. D: Expression of extracellular matrix protein in glomeruli of Thy1 rats at day 8. Collagen type I (a), type III (b), type IV (c), fibronectin (d), and laminin B2 (e) staining scores per glomerular cross-section are counted as described in Materials and Methods. Open bar, control rats (day 0); closed bar, nontreated Thy1 rats; hatched bar, Thy1 rats treated with 0.25 mg/L of warfarin; dotted bar, Thy1 rats treated with 0.5 mg/L of warfarin in D and E. *, P < 0.001 versus nontreated Thy1 rats. E: Urinary albumin excretion standardized by urinary creatinine of Thy1 rats at day 8. *, P < 0.001 versus nontreated Thy1 rats.

