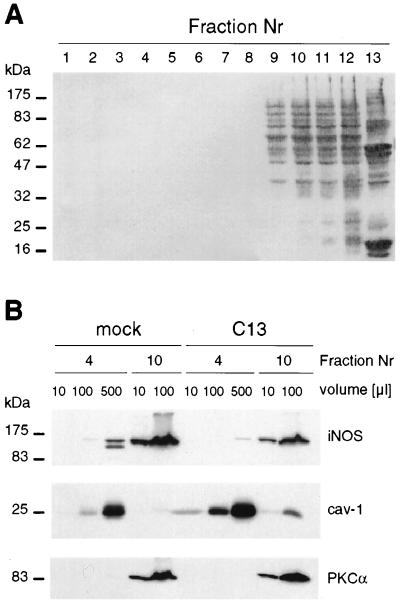
Figure 3.
Cofractionation of cav-1 and iNOS in detergent-insoluble fractions. Mock- or cav-1-transfected (C13) HT29 cells were stimulated during 15 h with cytokines, lysed in 1% Triton X-100, and fractionated on a sucrose gradient. Samples from each fraction (1–12) of the sucrose gradient (plus pellet; fraction 13) were characterized by Western blot analysis. (A) Total protein distribution in a representative gradient is shown after Ponceau Red S staining (10 μl was loaded for each fraction). (B) Western blot analysis of iNOS and cav-1 expression. The abundance of iNOS in the light fraction was determined by comparing increasing volumes (10, 100, or 500 μl) of fraction 4 and fraction 10 (10 or 100 μl). PKCα was used as a control protein that was absent from cav-1-containing fractions. Nr, number.

