
Figure 3.
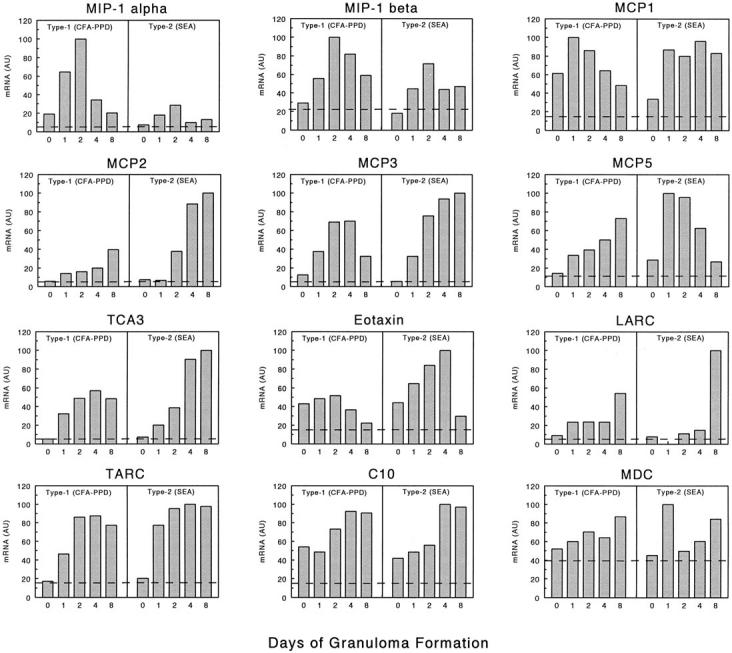
CC chemokine mRNA expression profiles of lungs during type-1 (PPD) and type-2 (SEA) Ag-bead lung granuloma formation. The mRNA expression levels were determined by PCR-ELISA analysis and the results are presented in arbitrary units (AU) as described in Materials and Methods. The profiles are representative of at least three independent experiments. In each experiment mRNA was prepared from three to four mice for each time point. Dashed lines indicate levels in normal lung controls.