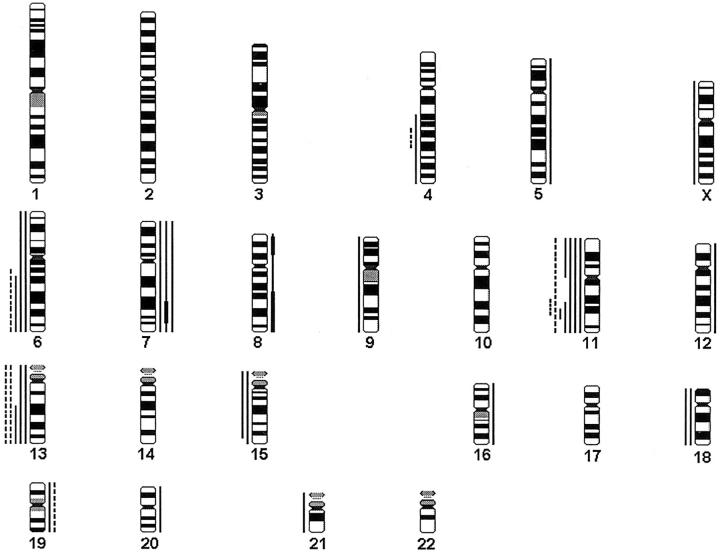
Figure 1.
A summary of gains and losses found in parathyroid hyperplasias and adenomas. Gains are shown on the right side of the chromosomes and losses on the left. Each line represents a genetic aberration seen in one tumor. Primary hyperplasias are marked with dashed lines and adenomas with solid lines. High-level amplifications are marked with a thick bar.

