
Figure 3.
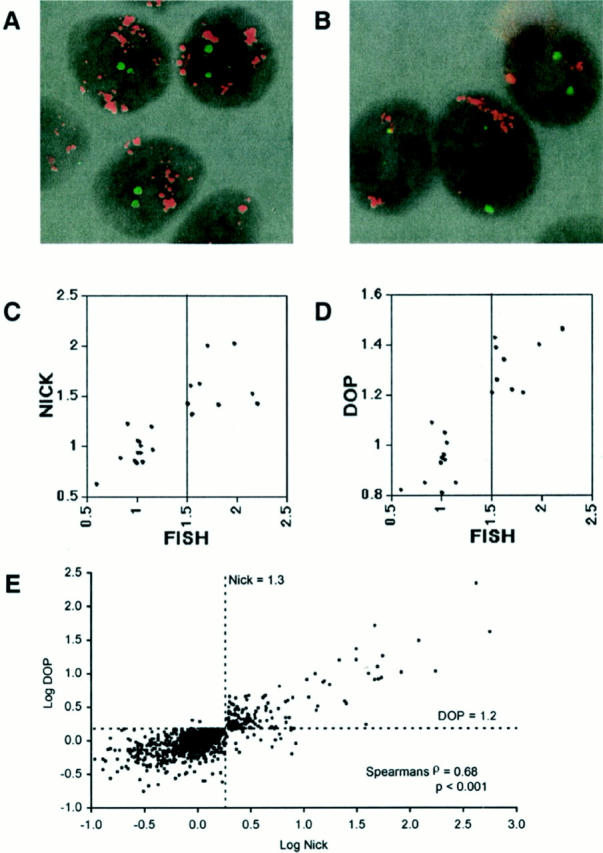
Determination of the fluorescence ratio threshold of array CGH. A: FISH analysis of the breast cancer cell line KPL-1 using ZNF217 and ERBB2 genes as probes. Each gene was labeled with SpectrumOrange (red fluorescence) and fluorescein isothiocyanate (green fluorescence), respectively. High-grade amplification of the ZNF217 gene was observed. B: FISH analysis of the breast cancer cell line SUM159 using MYC (red fluorescence) and centromeric (chromosome 17, green fluorescence) probes. High-grade amplification of MYC gene was shown. C and D: Scatterplot of the copy number index (x axis) determined by FISH of three different probes (MYC, ERBB2, and ZNF217) in nine breast cancer cell lines and the average fluorescence ratio (y axis) of the corresponding genes detected by array CGH (C, nick-translation; D, DOP-PCR). Highly amplified genes that cannot be quantitatively scored by FISH (because of diffuse distribution of signal or too many copies to count) were excluded from the comparative analysis between FISH and array CGH. E: Scatterplot of log (fluorescence ratio) for nick translation-based array CGH versus log (fluorescence ratio) for DOP-PCR-based array CGH for 57 genes in 18 human breast cancer cell lines. The dotted lines represent the fluorescence ratio thresholds for amplification.