
Figure 1.
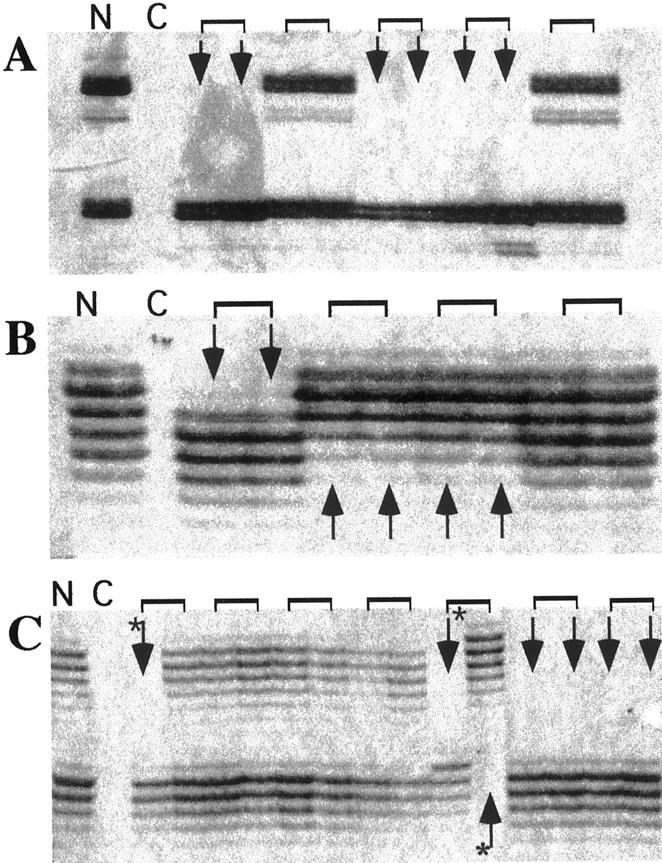
Example of microsatellite analysis of DOP-PCR templates derived from various PanINs. Amplification products were separated on a standard sequencing gel and visualized by silver staining. A: Microsatellite marker D9S304. B: Marker D17S786. C: Marker D18S363. Arrows, samples with allelic loss; brackets, pairs of microsatellite PCRs generated from the same DOP-PCR template; asterisks, examples of discordant PCR amplification patterns. N, normal DNA; C, negative control.