
Figure 2.
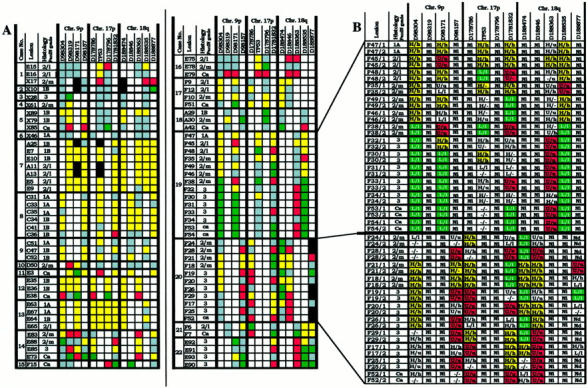
Microsatellite analyses of various grades of PanIN. A: Microdissected lesions were derived from specimens from 21 pancreatic carcinoma patients and from one patient with noncancerous pancreatic disease (case 13). Allelic loss at chromosomal regions 9p, 17p, and 18q, was determined with 13 microsatellite markers. For each microsatellite marker, a data set (squares) of four independent PCRs was generated per lesion. Denotation of the color-coded squares: yellow, heterozygosity; red, allelic loss of the upper allele; green, allelic loss of the lower allele; white, noninformative; gray, excluded data set, black, not done. B: Detailed microsatellite analysis data on two representative cases (cases 19 and 20). Data sets (see A) are represented in data pairs (in uppercase and lowercase) from two microsatellite PCRs that were performed on each of two DOP-PCR templates. 2/L, PanIN-2 lesion with low-grade dysplasia; 2/m, PanIN-2 lesion with moderate-grade dysplasia; U/u, allelic loss of the upper allele (PCR1/PCR2); L/L, allelic loss of the lower allele (PCR1/PCR2); H/h, heterozygosity (PCR1/PCR2); Nd, not done; Ni, noninformative; (−), failed PCR reaction.