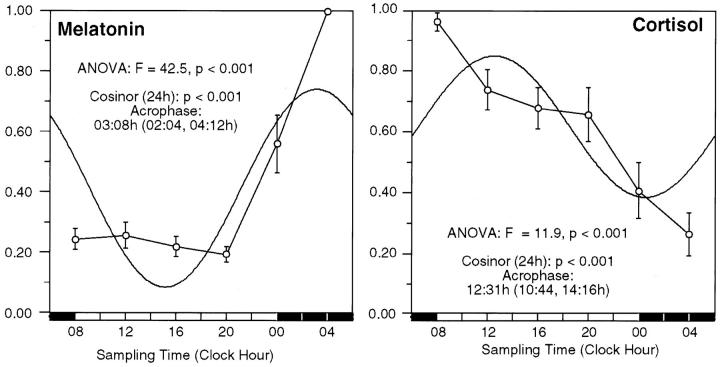
Figure 1.
Melatonin and cortisol rhythms during the 24-hour biopsy period. Normalized data for the serum melatonin and cortisol in eight study participants during the 24-hour biopsy period are shown. Time point means (normalized value) and SE are depicted along the 24-hour time scale. The best fitting 24-hour single component cosine curve is shown. The time for the acrophase (95% confidence limits), P value from cosinor analysis, and time-effect by analysis of variance are shown.

