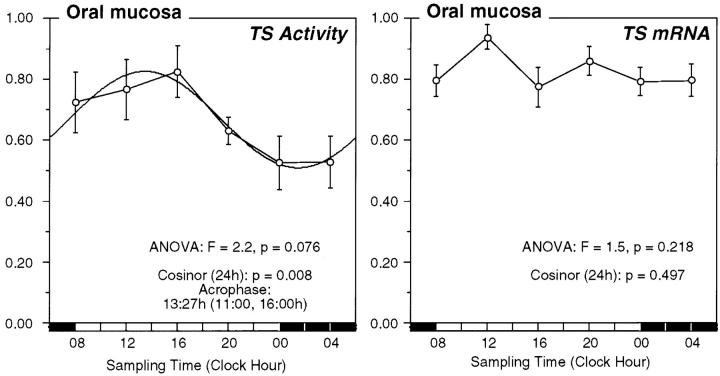
Figure 5.
Circadian TS activity and TS mRNA expression in oral mucosa. Normalized data for the circadian variation in TS enzyme activity and TS mRNA expression in human oral mucous in eight study participants. Time point means (normalized value) and SE are depicted along the 24-hour time scale. The best fitting 24-hour single-component cosine curve is shown. The time for the acrophase (95% confidence limits), P value from cosinor analysis, and time-effect by analysis of variance are shown.

