
Figure 1.
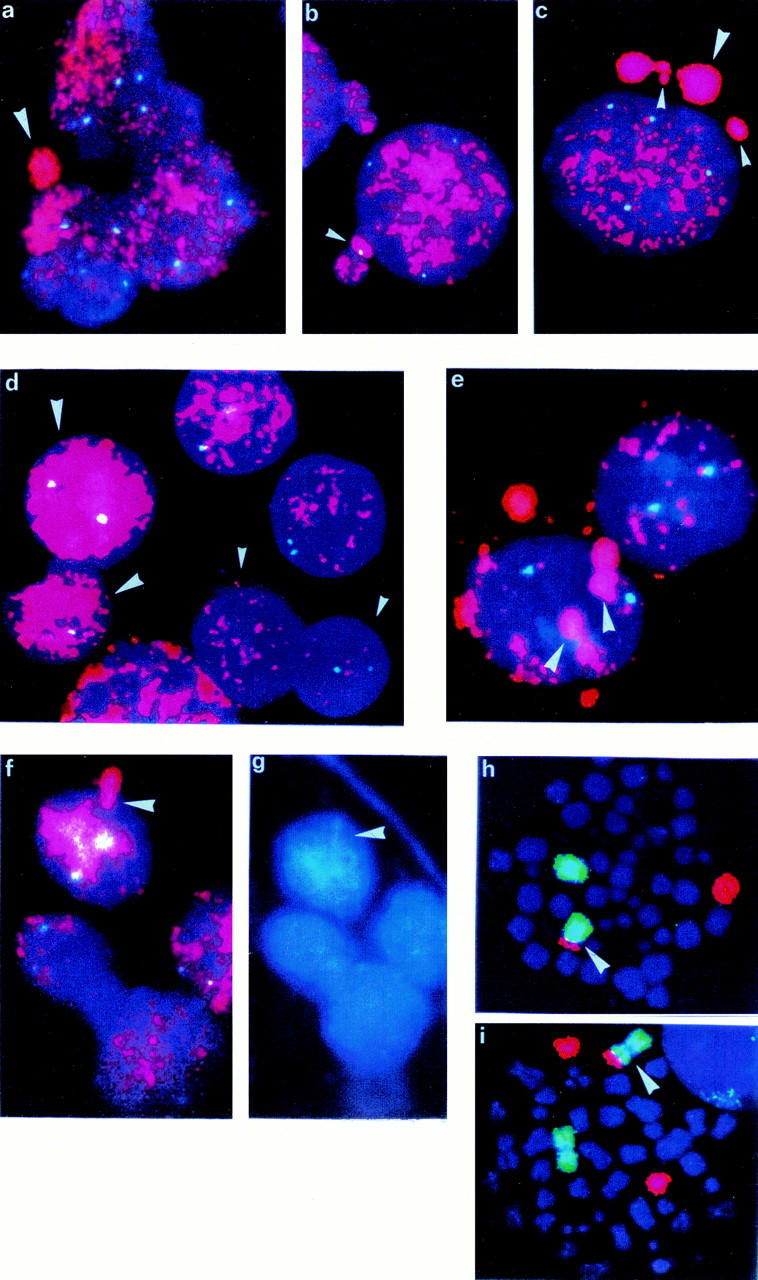
FISH with MYCN probe (red) and chromosome 2 centromeric probe (blue-green) a: Micronucleus seen directly in situ on touch imprint slide of NB6. b: Micronuclei in NB6 showing the centromeric signal of chromosome 2. c: Micronuclei of variable size seen in NB6. d: Amplification heterogeneity—dozens of copies of MYCN (small arrowhead) and hundreds of copies of MYCN (large arrowhead) in NB4. e: Accumulation of amplified material in well-defined area close to the nuclear membrane in NB2. f: Budding out of the nuclear membrane with amplified MYCN. g: The same picture in DAPI coloration showing drop-shape-like structure of extruded material in NB2 FISH with whole chromosome painting probes—chromosome 1 labeled by FITC, chromosome 17 by rhodamine. h: One der(1)t(1;17) (arrowhead) and one normal chromosome 1 and one normal chromosome 17 in NB4. i: One der(1)t(1;17) (arrowhead), one chromosome 1 normal, and two chromosomes 17 normal in NB3.