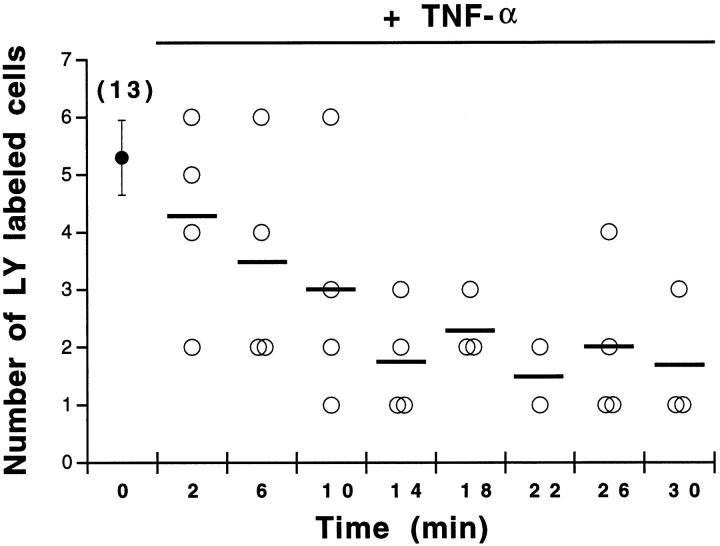
Figure 5.
Time course of TNF-α-induced dye uncoupling between non-CF cells. In the absence of TNF-α (time 0), the number of cells labeled with lucifer yellow (LY) averaged 5.3 ± 0.65 cells (n = 13 microinjections). Exposure of Beas2B cells to TNF-α was associated with a time-dependent decrease in the number of LY-labeled cells. Maximal uncoupling was reached within 20 minutes. Bars indicate the mean number of LY-labeled cells.

