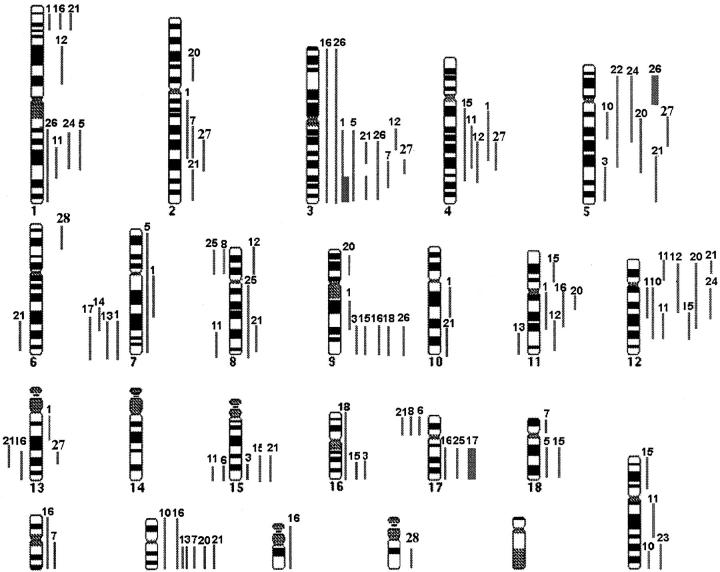
Figure 1.
Summary of the genomic imbalances in 29 patients with SMZL. Left: Lines indicate loss of chromosomal material. Right: Lines indicate gain of chromosomal material. High-level DNA amplifications are represented as solid squares. Each line represents a gained or lost region in a single tumor. The numbers on top of each line refer to the patient analyzed.

