
Figure 1.
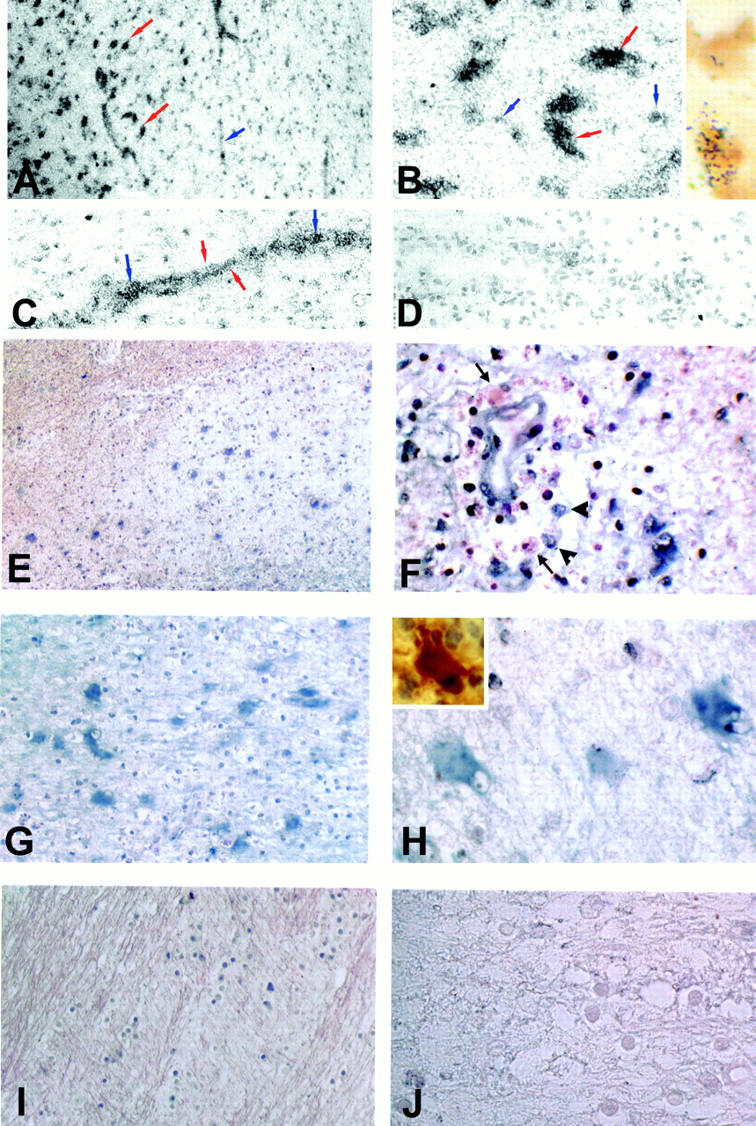
In situ hybridization for iNOS mRNA in MS lesions. To assess the distribution of iNOS mRNA in MS lesions tissues were reacted either with probes labeled with 35S (A–D) or with digoxygenin (E–J). A: A low-power view of the edge of an acute MS lesion shows prominent deposition of silver grains over large cells (red arrows) within the lesion (left), as well as in association with vascular elements (blue arrow). B: High-power view of the lesion center demonstrating intense labeling of large cells consistent with reactive astrocytes (red arrows), and a lower level reactivity decorating smaller cells (blue arrows). Inset shows the same lesion double-labeled for CD68 antigen (brown) and iNOS mRNA (silver grains). C: High-power view of an inflamed vessel. Note the linear array of silver grains consistent with reactivity of the vessel wall (red arrows) and more focal accumulations suggestive of reactivity in inflammatory cells (blue arrows). D: A control section reacted with sense RNA probe. E: Nonradioactive in situ hybridization for iNOS mRNA (blue) in an acute MS lesion. F: High-power view of a perivascular inflammatory cell cuff demonstrating inflammatory cells that are positive (arrowhead) as well as negative (arrows) for iNOS mRNA. Note that the endothelial cells also demonstrate iNOS mRNA reactivity. G: Higher power view of the lesion demonstrating intense reactivity (blue) throughout the lesion center. H: Large cells within the lesion center expressing intense iNOS mRNA reactivity (blue) are compatible with hypertrophic astrocytes stained for S100β in serial sections (inset). I: Normal appearing adjacent white matter showing lack of iNOS mRNA expression. J: Same lesion as in E hybridized with a control sense probe. Original magnifications: ×200 (A and E), ×400 (C, D, I, and J), ×800 (B, F, and H), and ×1000 (I, insets in B and I).