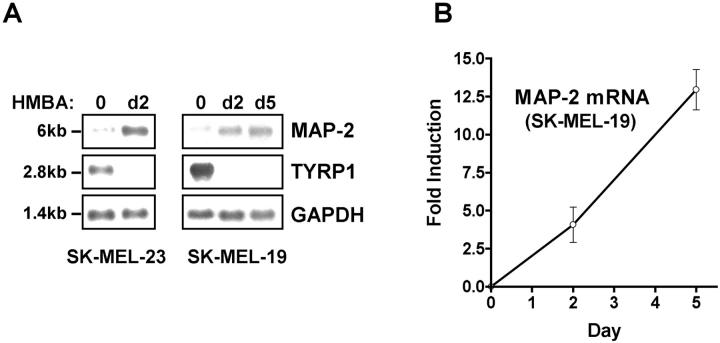
Figure 2.
Up-regulation of MAP-2 mRNA in melanoma cells by HMBA. A: Northern blot analysis. Three μg of polyA+ RNA isolated from untreated SK-MEL-19 and SK-MEL-23 cl.22 melanoma cells and cells treated with HMBA for 2 to 5 days was electrophoresed, blotted, and hybridized with 32P-labeled probes as described in Materials and Methods. B: Quantitative analysis of MAP-2 mRNA induction in SK-MEL-19 melanoma cells. Band intensities were measured, normalized to GAPDH, and plotted as relative intensities. Data shown are means ± SEM from three independent experiments.

