
Figure 3.
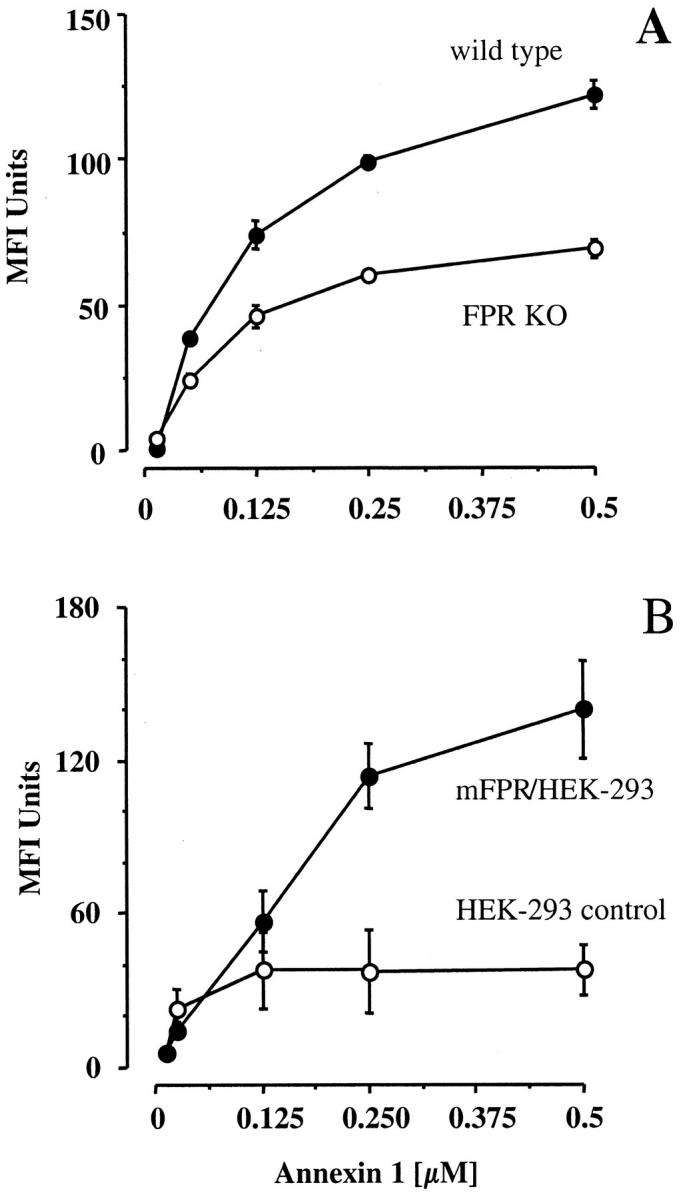
Characterization of ANXA1 binding in vitro. A: Reported is a saturation concentration-response curve for ANXA1 binding to peritoneal MØ collected from wild-type or FPR KO mice (pool of four animals), as determined in vitro. Data are means ± SEM of triplicate determinations, and are representative of three distinct experiments. B: ANXA1 binding to 293 control cells and to 293 cells transfected with mouse FPR is shown. Data are from three experiments performed in duplicate.