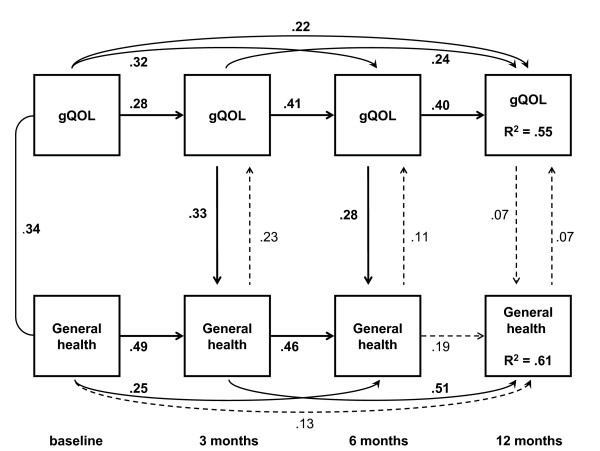
Figure 4.
Simultaneous effects model. This model demonstrates bidirectional causal paths at each time-point observed after baseline. The path from general health towards overall quality of life occurs at the same time as the path from overall quality of life towards general health perceptions is observed. Two of the six simultaneous paths are statistically significant in the direction from 3 and 6 months' gQOL towards the corresponding scores on the SF-36 General health subscale. As with the cross-lagged paths, this model includes strong serial associations over time within each variable except between 6 and 12 months' general health perceptions. Straight and curved single arrows indicate the causal paths modeled. The corresponding decimals are standardized regression coefficients. Bold face coefficients indicate p < 0.05 while broken lines are used for paths with a corresponding p ≥ 0.05. The curved line between baseline variables represents a correlation; the number is the corresponding correlation coefficient. Model fit indices are summarized in Table 3. For correct model specification of simultaneous effects, the present baseline assessment provides exogenous and correlated variables, without simultaneous effects at this time-point.

