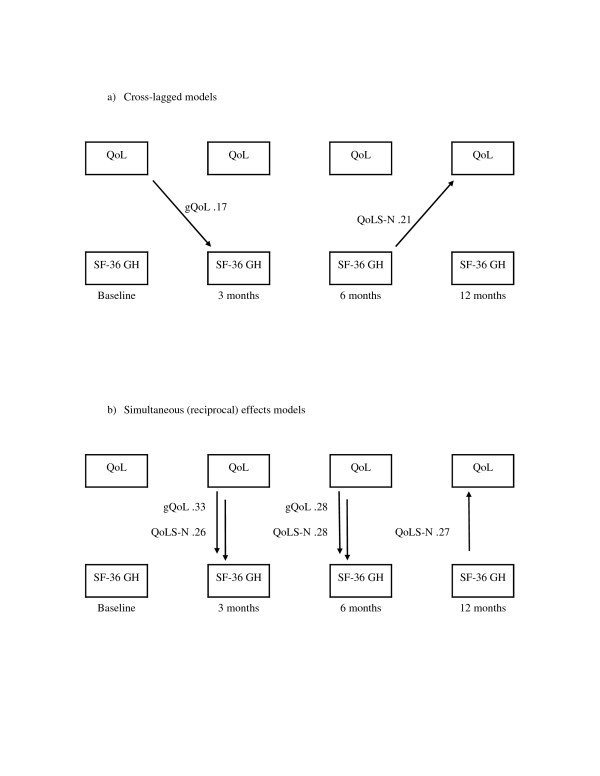
Figure 5.
Comparison of significant a) cross-lagged and b) simultaneous paths from two sets of modeling with two different quality of life instruments: gQoL and QoLS-N. Figure 5 summarizes only the statistically significant paths observed between General Health and overall Quality of Life, indicated as arrows in the direction of causality. The causal paths are labeled with their corresponding QoL instrument and standardized regression coefficients derived from structural equations. Paths within each concept from one time-point to another, for example from General Health at three months to General Health at 12 months, are not drawn. See Table 3 for model fit indices, and Additional files 1 through 4 for separate model parameters.

