
Figure 2.
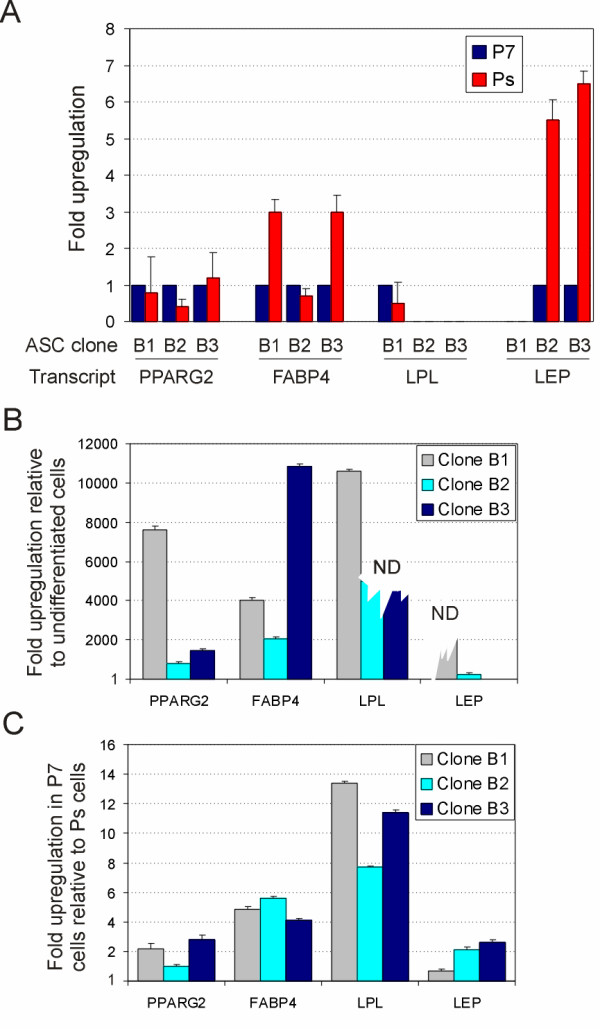
Expression of adipogenic genes upon differentiation of P7 and senescent ASCs. (A) LEP, PPARG2, FABP4 and LPL transcript levels were determined in undifferentiated Ps cells (clones B1, B2, B3) relative to undifferentiated P7 cells. For each clone, the mRNA level detected at P7 was attributed a value of 1 and the mRNA level in the same clone at Ps was expressed relative to that. A value of 0 (no bar) indicates that the gene is not expressed. (B) At senescence, each clone was induced to differentiate and mRNA levels compared to those of undifferentiated cells (level 1). 'ND' indicates that the gene was upregulated but relative levels could not be determined because transcripts were undetected in undifferentiated cells (jagged bars). (C) Transcript levels in cells differentiated at P7 were expressed relative to those in cells differentiated at Ps (level 1). Each panel shows the mean fold upregulation from triplicate RT-PCRs from at least two separate cDNA preparations.