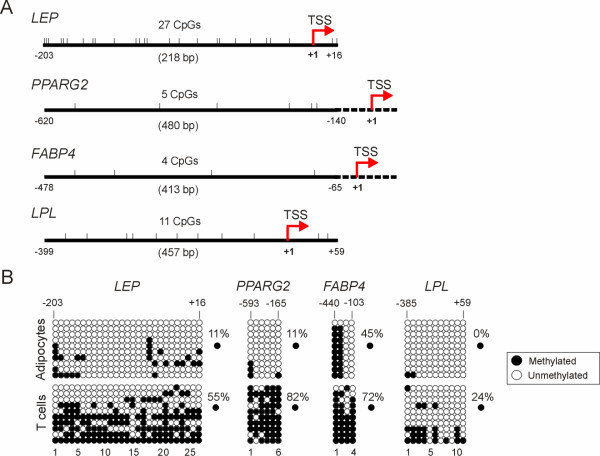
Figure 3.
DNA methylation analysis of adipogenic promoters in human adipocytes and T cells. (A) Map of CpG dinucleotides (tick marks) examined in the LEP, PPARG2, FABP4 and LPL promoters. Regions examined are indicated by the continuous line. Numbers are relative to the transcription start site (TSS). (B) Bisulfite sequencing of LEP, PPARG2, FABP4 and LPL promoters in differentiated human SGBS adipocytes and in purified peripheral blood T cells. Ten bacterial clones of PCR products were sequenced. Each row represents one bacterial clone with one circle symbolizing one CpG. Top numbers indicate position of CpGs relative to the TSS. Bottom numbers are CpG numbers, with No. 1 being the 5'-most cytosine in the sequence examined.

