Figure 6.

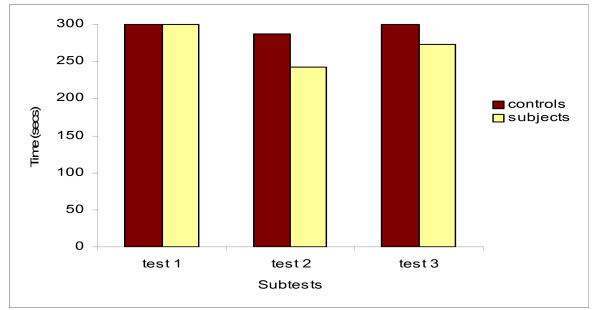
Comparison of Mean Group Times. This figure shows FIT-HaNSA times for shoulder patients versus controls. Significant differences were observed for Task 2 and Task 3. All subjects performed 5 full minutes of Task 1.

Comparison of Mean Group Times. This figure shows FIT-HaNSA times for shoulder patients versus controls. Significant differences were observed for Task 2 and Task 3. All subjects performed 5 full minutes of Task 1.