
Figure 4.
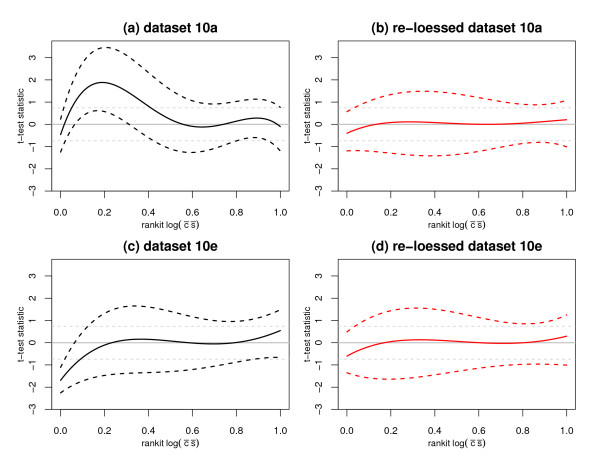
Estimates of the null t-test statistic quartiles vary as a function of signal intensity for datasets 10a (a, b) and 10e (c, d); although less so for the re-loessed data. The x-axes correspond to the rankit (i.e., ) of the log of the product of the expression means. The y-axes correspond the observed two-sided t-test statistics. Solid and dashed grey lines indicate the theoretical medians and quartiles, respectively. The null t-test statistics were modeled as a function of a 4th order polynomial for rankit intensity. Black and red lines correspond to the quantile regression fits for τ = 0.5 (solid) and τ = 0.25, 0.75 (dashed). The overwhelming positive deviation of the null distribution in (a) is consistent with the discrepancy between the one-sided p-values observed in Figure 2(b). Portions of this figure appear with permission in the response to [2].