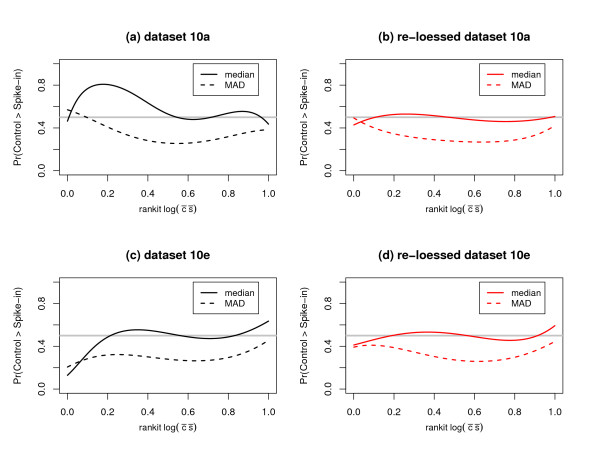
Figure 6.

A diagnostic plot to assess, as a function of signal intensity, whether or not the underlying distributions for the control and spike-in expression values share the same center and scale. The x-axes correspond to the rankit (i.e., ) of the log of the product of the expression means. The y-axes correspond the probability that the control samples will have a value greater than the spike-in sample; values for the median and the MAD (median absolute deviation) were considered. The horizontal solid gray line corresponds to a probability of . The probability that, for a randomly sampled probeset, the control samples will have a value greater than the matched spike-in samples was modeled as the logit of a 4thorder polynomial for rankit intensity. Solid (dashed) lines correspond to the logistic regression fits for the median (MAD). Diagnostic plots (a) and (c) indicate that, prior to re-loessing, the control and spike-in expression values were not equivalently centered and scaled for all signal intensities. Diagnostic plots (b) and (d) indicate that re-loessing the data provided control and spike-in expression values which were equivalently centered and but not equivalently scaled. Although loess correcting using only the set of true invariants can provide Stage II data which is adequately re-centered, issues pertaining to relative scale may remain and can invalidate the null distributions of commonly used two sample test statistics.
