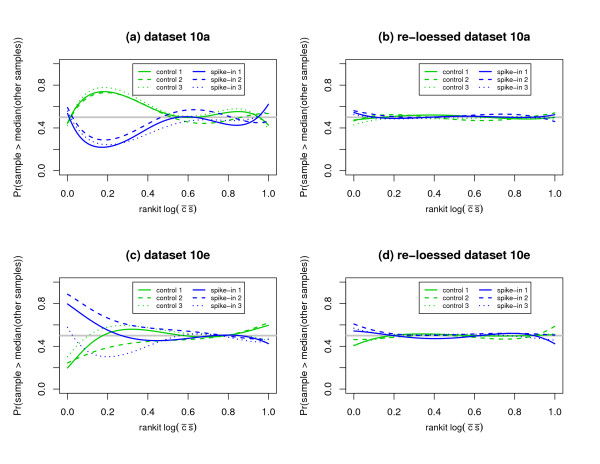
Figure 7.

A diagnostic plot to assess, as a function of signal intensity, whether or not the underlying distributions for the expression values from each chip/sample share the same center. The x-axes correspond to the rankit (i.e., ) of the log of the product of the expression means. The y-axes correspond the probability that the observed expression value for a given sample will exceed the median of the expression values for the samples not under direct examination. The horizontal solid gray line corresponds to a probability of . The probability that the sample under consideration will have an expression value greater than the median of the expression values for the samples not under direct examination, was modeled as the logit of a 4th order polynomial for rankit intensity. Colored lines correspond to the logistic regression fit values. The within subpopulation logistic model fits are remarkably consistent for dataset 10a and are less so for dataset 10e. Plots (a) and (b) suggest that problems with relative centering can not be attributed to one or two "outlying" samples. Rather, these plots support the hypothesis that the Stage I pre-processing algorithms could not adequately adjust for differences in the underlying population distributions of the expression values for the empty probesets.
