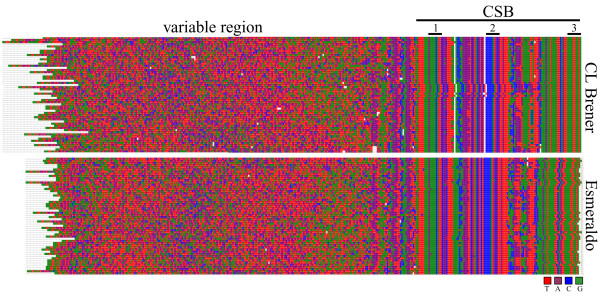
Figure 2.
Alignments of CL Brener and Esmeraldo minicircle variable regions. Spectrogram representation of the CLUSTALX alignment of minicircle sequences identified from the CL Brener (top) and Esmeraldo (bottom) WGS reads. Each base within each read is represented as a coloured square ('T'-red; 'A'-purple; 'C'-blue; 'G'-green).

