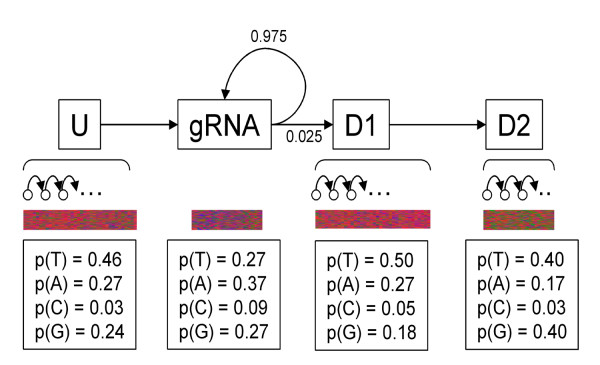
Figure 8.
A Hidden Markov Model for the independent prediction of gRNA genes. Shown here is the overall structure of the HMM used to predict gRNAs from nucleotide probabilities. The first line depicts the four states: 'upstream', 'gRNA', 'downstream 1' and 'downstream 2', as well as the presence of sub-states for each. The implicit 'START' and 'END' states are not shown. The transition probabilities from the gRNA state are shown, otherwise the transitions are assumed to occur invariably. Depicted below the model is a visual representation of the nucleotide preferences for each state (T-red, A-purple, G-green, C-blue) and the emission probabilities used for each state.

