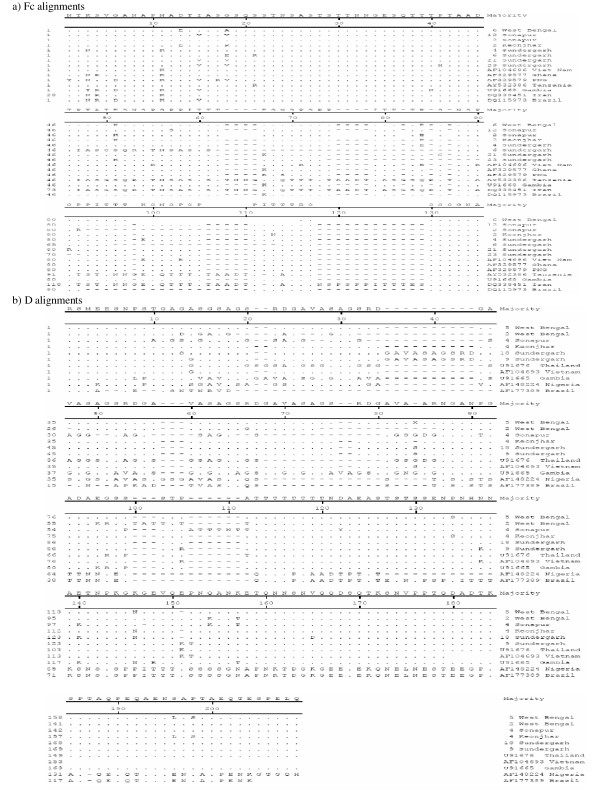
Figure 3.
Alignment of the amino acid sequences corresponding to a) FC27 and b) 3D7 families of msp-2. Sequences shown are either of isolates collected during the study or from the GenBank database. Deletions are represented by minus sign (-) and alphabets represent a change in amino acid at the position.

