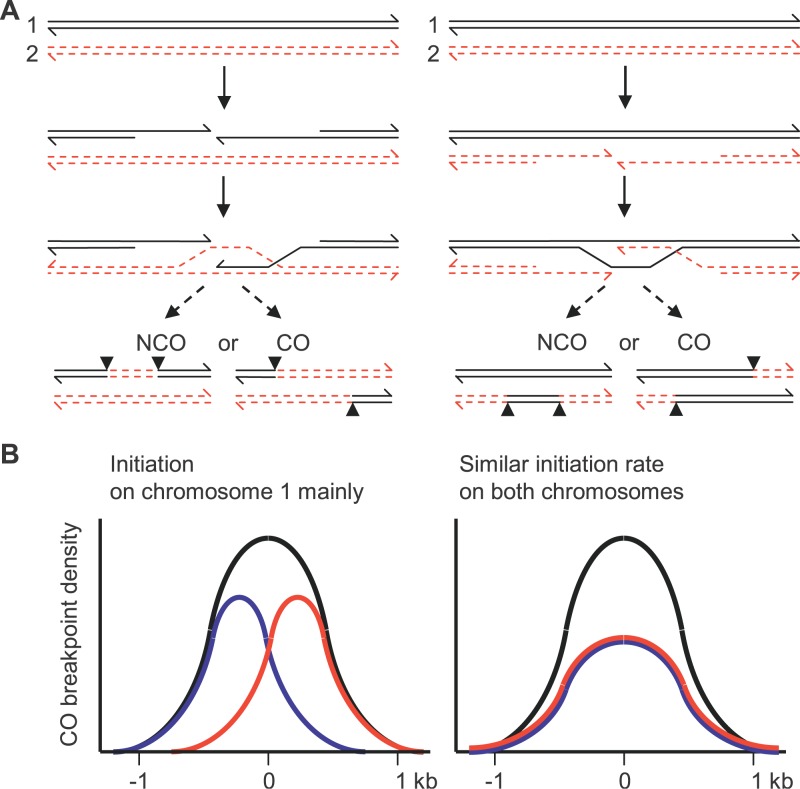
Figure 3. Distribution of Exchange Points at an Initiation Site.
(A) A model for meiotic recombination is shown. The region surrounding the initiating DSB, between the breakpoints (arrowheads), is converted. The molecule having suffered the initiating DSB is the recipient of genetic information [2,3]. The CO exchange breakpoints are shifted in opposite directions, depending on which is the initiating chromosome (left panel, Chromosome 1 and right panel, Chromosome 2).
(B) The expected distribution of CO exchange breakpoints at an initiation site is shown: blue, Chromosome 1 to Chromosome 2 orientation; red, Chromosome 2 to Chromosome 1 orientation; black, sum of exchanges in both orientations. On the left panel initiation is mainly on Chromosome 1. On the right panel initiation on both chromosomes is with similar frequency.

