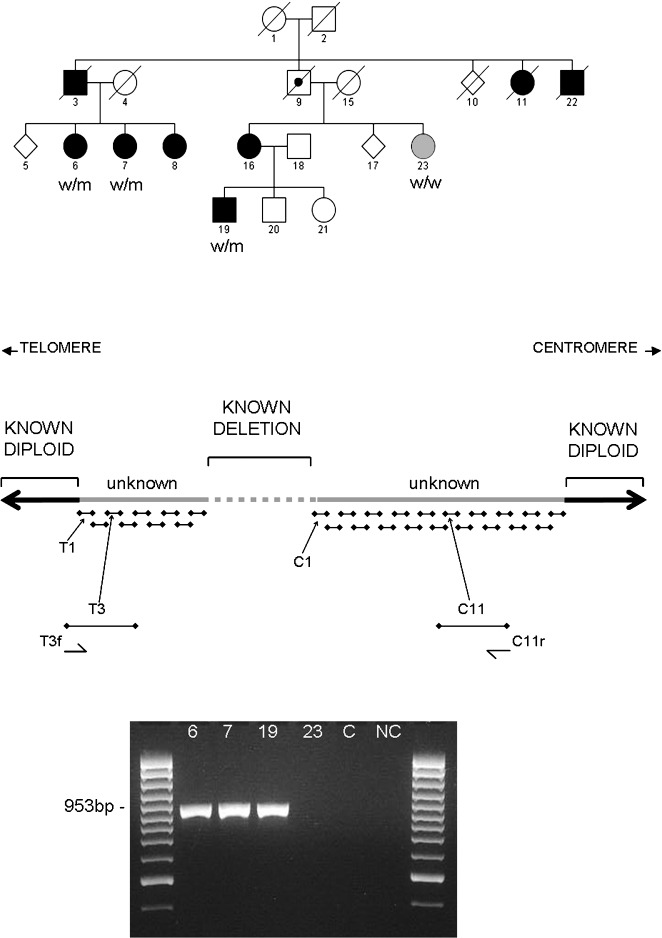
Figure 3. Mutation Analysis in the Australian SCA15 Family.
(Top) Pedigree of kindred. Filled symbols denote affected individuals; open symbols, unaffected individuals; grey symbol denotes unknown disease status; bulls-eye symbol denotes obligate carrier. w/w, wild-type at ITPR1; w/m, heterozygous carrier of the ITPR1 deletion.
(Middle) Schematic of primer pairs used to narrow the unknown regions between known deleted sequence and known diploid sequence at the SCA15 locus. Nine primer pairs (T1–T9) were used to amplify across the unknown region telomeric to the known deleted region; 19 primer pairs (C1–C19) were used to amplify across the unknown region centromeric to the known deleted region. All PCRs were carried out in the three affected family members. Analysis of these data narrowed the unknown region, and ultimately we were able to use primer T3f and C11r to amplify across the deletion breakpoint in the three affected family members, producing a fragment of 953 bp in affected individuals.
(Bottom) Gel showing amplification product using primer pair T3f and C11r from affected pedigree members 6, 7, and 19; in pedigree member 23, with unknown disease affection status; in a neurologically normal control (C); and in a no template control (NC).

