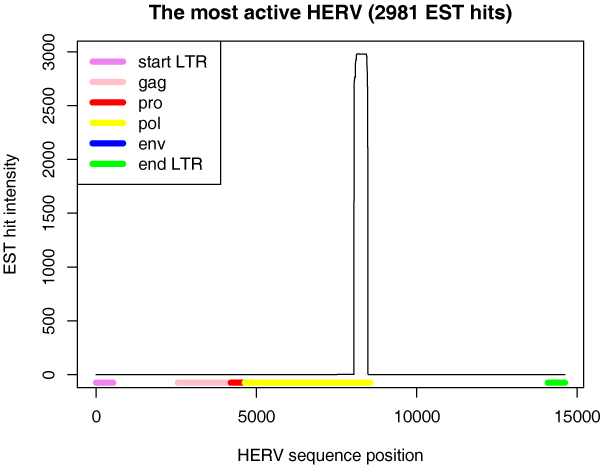
Figure 3.

EST hit location for the most active HERV. The colored blocks below the curve represent the HERV structure (genes, LTRs) and the curve presents EST hit intensity along the HERV structure. See Table 1 for more information on this HERV. EST hit areas for other highly active HERVs are shown in Supplementary Fig. 4 in Additional file 1.
