
Figure 6.
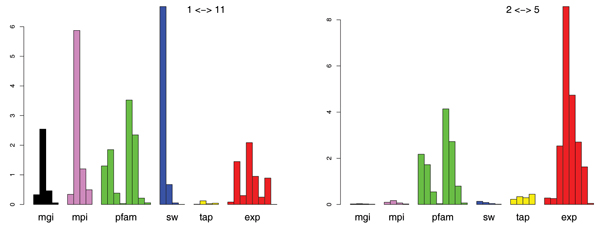
Kernel weights for the pairwise model. Kernel weights for the pairwise model. Left: separating classes metabolism and control of cellular organization. Right: classes energy and protein synthesis. The kernels are arranged in groups according to their origin: genetic interaction (mgi), prot.-prot. interaction (mpi), domain structure (pfam) string alignments (SW), protein complexes (tap) and gene expression (exp). The 8 gene expression RBF kernels represent the data in [16-20] and three RBF kernel variants of the data in [21] (left to right).