
Figure 1.
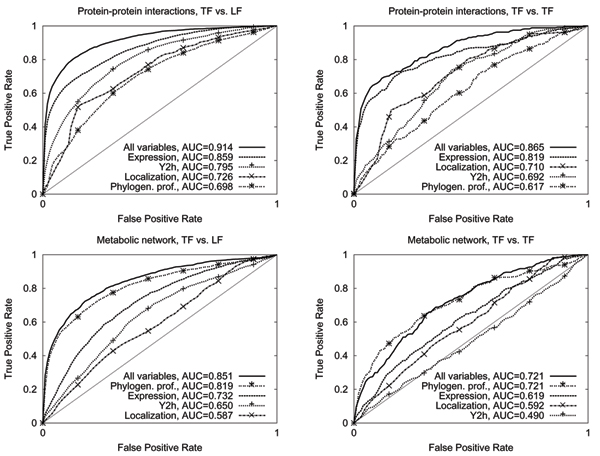
ROC curves. ROC curves for TF vs. LF edges (left) and TF vs. TF edges (right) with different sets of inputs, on the protein-protein interaction network (top) and the metabolic network (bottom).
Official websites use .gov
A
.gov website belongs to an official
government organization in the United States.
Secure .gov websites use HTTPS
A lock (
) or https:// means you've safely
connected to the .gov website. Share sensitive
information only on official, secure websites.
ROC curves. ROC curves for TF vs. LF edges (left) and TF vs. TF edges (right) with different sets of inputs, on the protein-protein interaction network (top) and the metabolic network (bottom).