
Figure 3.
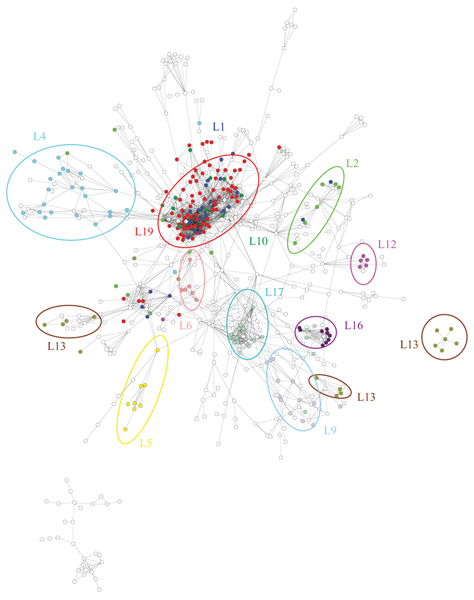
Graph clustering. The projection of the tree leaves in Figure 2 on the protein-protein interaction network. Only the leaves that contain more than 5 proteins and 5% of connections are represented.
Official websites use .gov
A
.gov website belongs to an official
government organization in the United States.
Secure .gov websites use HTTPS
A lock (
) or https:// means you've safely
connected to the .gov website. Share sensitive
information only on official, secure websites.
Graph clustering. The projection of the tree leaves in Figure 2 on the protein-protein interaction network. Only the leaves that contain more than 5 proteins and 5% of connections are represented.