
Figure 1.
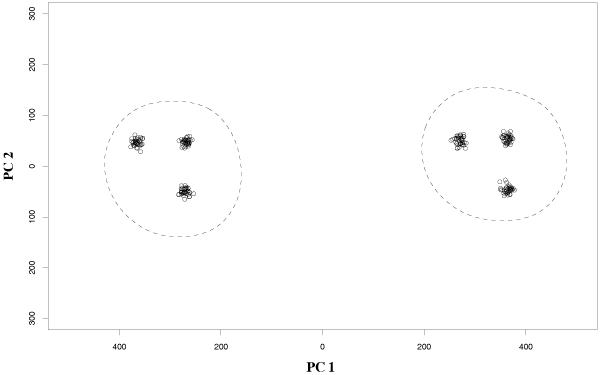
A two-level hierarchical structure with 2 and 6 clusters is revealed by principal components analysis (data projected into the two components with highest variance).
Official websites use .gov
A
.gov website belongs to an official
government organization in the United States.
Secure .gov websites use HTTPS
A lock (
) or https:// means you've safely
connected to the .gov website. Share sensitive
information only on official, secure websites.
A two-level hierarchical structure with 2 and 6 clusters is revealed by principal components analysis (data projected into the two components with highest variance).