
Figure 2.
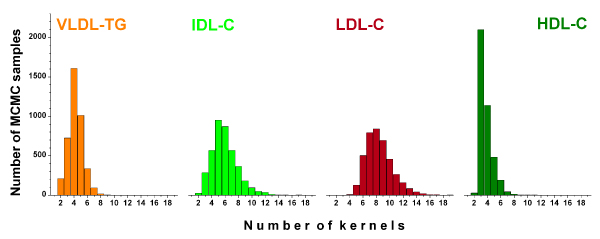
The kernel distributions in the Bayesian models. The marginal posterior distribution for the number of kernels in the Bayesian models for the VLDL-TG (orange), IDL-C (lime), LDL-C (sherry) and HDL-C (olive).
Official websites use .gov
A
.gov website belongs to an official
government organization in the United States.
Secure .gov websites use HTTPS
A lock (
) or https:// means you've safely
connected to the .gov website. Share sensitive
information only on official, secure websites.
The kernel distributions in the Bayesian models. The marginal posterior distribution for the number of kernels in the Bayesian models for the VLDL-TG (orange), IDL-C (lime), LDL-C (sherry) and HDL-C (olive).