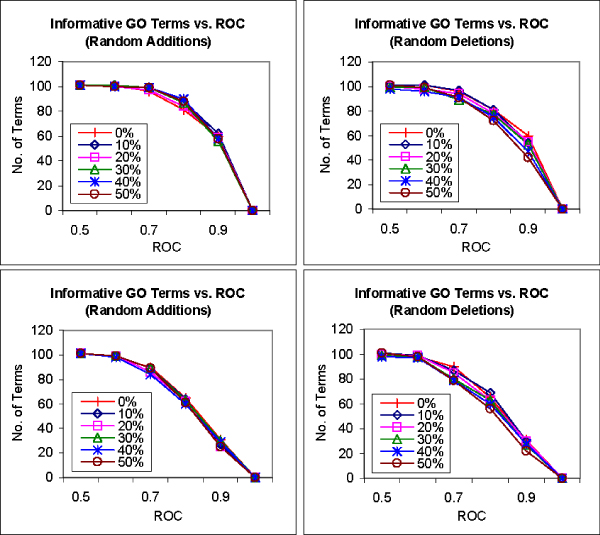
Figure 6.

Effect of noisy interaction data on FS-Weighted Averaging. Graphs showing the number of informative terms from the Gene Ontology biological process category that can be predicted greater than or equal various ROC thresholds using FS-Weighted Averaging (top) and Neighbor Counting (bottom) on synthetically modified interaction data. Interactions are randomly 1) added to the interaction network (left) and 2) removed from the interaction network (right) in varying degrees from 10% to 50% of the number of interactions in the original interaction.
