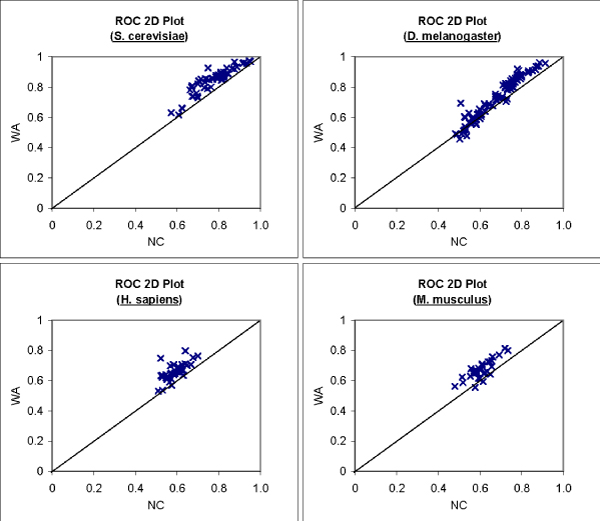
Figure 7.

Effect of indirect interactions on prediction performance for individual GO terms. 2D Plot of ROC scores of predictions made by neighbor counting versus FS-Weighted Averaging for Level-4 biological process GO terms that are annotated to at least 30 proteins.
