Figure 3.

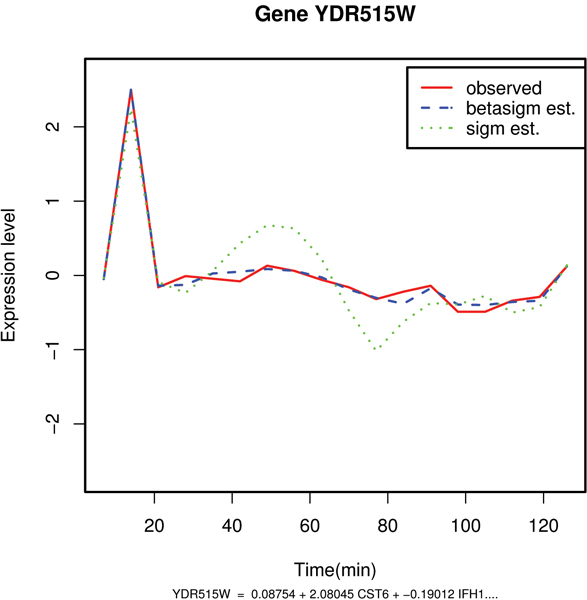
Comparative plot between the observed and the predicted values of mRNA expression levels of gene YDR515W. Example of good estimation of the expression profile with the beta sigmoid pattern of regulation: gene YDR515W.

Comparative plot between the observed and the predicted values of mRNA expression levels of gene YDR515W. Example of good estimation of the expression profile with the beta sigmoid pattern of regulation: gene YDR515W.