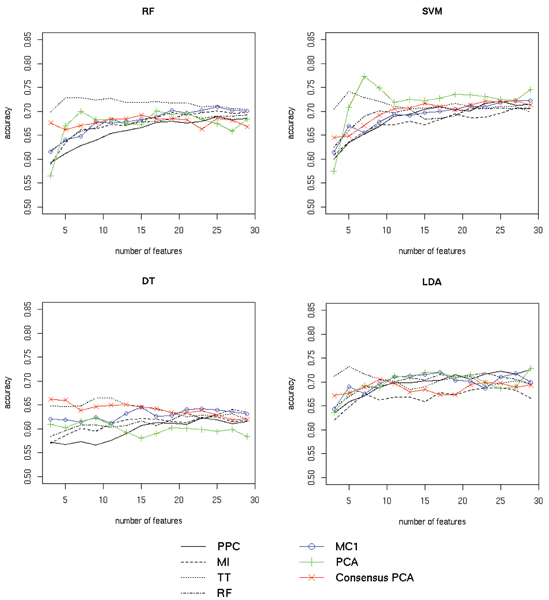
Figure 3.

Ovarian cancer classification results. Classification results for four classifiers (random forest (RF), SVM, decision trees (DT) and LDA) on the MALDI-TOF ovarian cancer dataset are shown separately in the four panels. Classifier performance using a specified number of best features from individual scoring functions (peak probability contrast (PPC), mutual information (MI), t-statistic (TT) and random forest feature ranking (RF)) are plotted in black. Performance with features selected by MC1 rank aggregation of the four functions is shown in blue. Results for regular PCA and our modified "Consensus" version using only the best features from the four scoring functions are plotted in green and red respectively. For all methods the average accuracy (fraction of samples correctly classified) over 20 cross-validation runs is shown. See Section Results for discussion.
